The remote debugging of the Java program is an ultimate tool in the arsenal of a Java developer, which is often becoming the last and only tool to investigate a bug on a Java application running on the remote host like on a Linux server or Windows server. Almost all major Java IDE provides remote debugging like NetBeans, Eclipse, and IntelliJ IDEA, but I mostly use Eclipse for Java coding and so it's my preferred tool to remote debug a Java program. In order to set up remote debugging in Eclipse, you need to do a couple of tasks like you need to start your JVM with debugging parameters or arguments and then you need to create a "remote debug configuration" in Eclipse IDE itself.
I have been sharing a lot of Eclipses tips and tricks in this blog like how to escaping JSON strings in Eclipse to easily create JSON for testing and debugging purposes.
In this article, I'll not only teach you how to set up remote debugging in Eclipse by walking through a step-by-step guide but also teach you how to actually debug a Java program running on a remote Linux server.
I'll also tell you how to use essential debugging commands like Step Into, Step Over, and how to watch variables while debugging, which will not only helpful during remote debugging but also during local debugging, right from Eclipse.
Btw, before starting this tutorial, I expect that you are familiar with both Java, JVM, and Eclipse IDE itself because when we talk about Run and Debug configuration, you should understand what we are talking about.
I'll show you every step using the screenshot and explain to you what we are doing and why we are doing but some basic knowledge of Eclipse is required. If you don't know Eclipse or never used Eclipse before, you won't be able to understand whatever I say.
That's why, If you are a complete beginner then I suggest you first go through a comprehensive Java course like The Java MasterClass and Beginners Eclipse Java IDE Training Course to learn Java and Eclipse a little bit better before starting with remote debugging. That will help you to use Eclipse IDE effectively for Java development.
Though there are different JVM options to start your JVM in debug mode, depending upon which version of JRE you are using.
If you're using Java 1.4 JRE then you need to use -Xdebug and -Xrunjdwp arguments. These options will also work in later versions, but it will run in interpreted mode instead of JIT, which will be slower.
Btw, I really hope Eclipse should have something similar to IntelliJ IDEA which makes it easy to remember the JVM debugging options as shown below:
From Java 5.0, it is better to use the -agentlib:jdwp as a single option e.g. :
Options on -Xrunjdwp or agentlib:jdwp arguments are almost the same:
transport=dt_socket: means the way used to connect to JVM (the socket is a good choice, it can be used to debug a distant computer)
address=11001: TCP/IP port exposed, to connect from the debugger,
suspend=y: if 'y', tells the JVM to wait until the debugger is attached to begin execution, otherwise (if 'n'), starts execution right away.
If you are debugging for an event that happens during startup then you can use the suspend="y" to go through the startup sequence step by step. On the other hand, if the issue is happening after it receives a message or request then you can start with suspend="n" and connect it later. See Eclipse Debugging Techniques And Tricks for more of such tips.

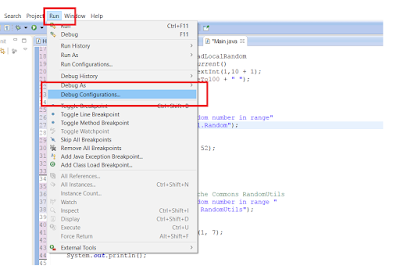
2.1) Go to debug configuration from Run menu as shown below:
2.2) Go to remote Java application
2.3) Configure details e.g. name, project, the Eclipse project which contains the code of the Java application you are trying to debug. Connection type should be "socket attach" and then specify host and port in Connection properties as shown below. Always specify a fully qualified domain name for the host
2.4) Hit apply after making a change

You are done with setting up remote debugging in Eclipse. In the next part of this article, I'll show you how to remotely debug a Java application step by step.
This is also known as line breakpoint, btw, don't put line breakpoint on empty lines. Also, if you are just starting with debugging, you can start by putting a breakpoint in the main() method which is the entry point of the Java application.

A couple of things to note here, we are starting JVM on server mode and asking it to suspend until the debugger connects it, which means it will not start execution until you start your Eclipse IDE and launch remote debug.
It is also listening for the debugger on port 11001, which means your Eclipse remote debugging setting should also use the same port.
Once you start the JVM, it will print the following line the log file or command line, depending upon where you are redirecting the output stream:
Listening for transport dt_socket at the address: 11001
This means JVM is ready to attach the debugger and now it's time to start remote debugging in Eclipse IDE. Btw, if you are not familiar with Java Virtual machines then I suggest you go through the Understanding the Java Virtual Machine series on Pluralsight, which explores JVM Memory Management, Classloading, Security, and other important details.

By the way, you would need a Pluralsight membership to join this course which costs around $29 per month or $299 per year (14% discount). I highly recommend this subscription to all programmers as it provides instant access to more than 7000+ online courses to learn any tech skill. Alternatively, you can also use their 10-day-free-pass to watch this course for FREE.
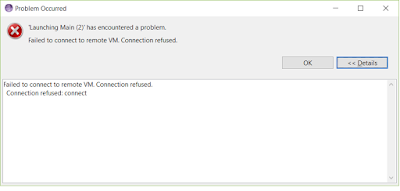
This error means either your JVM is not running but if you are sure that JVM is indeed started and ready to connect then maybe your host and port configuration is incorrect e.g. any typo on fully qualified domain name or any network issue which preventing your local machine to connect to the remote host.
If your Eclipse IDE is successful to establish a connection to debugger running on remote JVM then Eclipse will open a debug perspective and you could see where exactly JVM has stopped, a full stack trace starting from loading the classes.
Now, you got control of flight and it's up to you how you move.
When you first time debugs a Java program, Eclipse will ask you to open the Debug Perspective and then next time it will automatically do so.
Here is how Eclipse' Debug Perspective look like:

In Debug Perspective, you have a lot of debugging tools like you can execute code step by step, can see where you have put breakpoints, can watch values of variables, and can see which thread you are debugging and can terminate the debugging session. The debug perspective is the same for both local and remote debugging.
Alternatively, you can use Step Over to just go over the method call and move to the new line. You can use a combination of these two commands to effectively move around an interesting read to find any bug or observer the output in the log file. The button to Step Over is just next to Step Into as seen in the above screenshot.
I have been sharing a lot of Eclipses tips and tricks in this blog like how to escaping JSON strings in Eclipse to easily create JSON for testing and debugging purposes.
In this article, I'll not only teach you how to set up remote debugging in Eclipse by walking through a step-by-step guide but also teach you how to actually debug a Java program running on a remote Linux server.
I'll also tell you how to use essential debugging commands like Step Into, Step Over, and how to watch variables while debugging, which will not only helpful during remote debugging but also during local debugging, right from Eclipse.
Btw, before starting this tutorial, I expect that you are familiar with both Java, JVM, and Eclipse IDE itself because when we talk about Run and Debug configuration, you should understand what we are talking about.
I'll show you every step using the screenshot and explain to you what we are doing and why we are doing but some basic knowledge of Eclipse is required. If you don't know Eclipse or never used Eclipse before, you won't be able to understand whatever I say.
That's why, If you are a complete beginner then I suggest you first go through a comprehensive Java course like The Java MasterClass and Beginners Eclipse Java IDE Training Course to learn Java and Eclipse a little bit better before starting with remote debugging. That will help you to use Eclipse IDE effectively for Java development.
3 Steps to Setup Remote debugging of a Java application in Eclipse IDE
1) Start JVM with debug arguments
In order to debug a Java application running on a remote host(Linus or Windows), you first need to start the JVM with debugging arguments, as shown by the following command:$ /oracle/jre/v1.6.0_18-64bit/bin/java -Xdebug
-Xrunjdwp:transport=dt_socket,address=11001,server=y,suspend=y -jar app.jar
Though there are different JVM options to start your JVM in debug mode, depending upon which version of JRE you are using.
If you're using Java 1.4 JRE then you need to use -Xdebug and -Xrunjdwp arguments. These options will also work in later versions, but it will run in interpreted mode instead of JIT, which will be slower.
Btw, I really hope Eclipse should have something similar to IntelliJ IDEA which makes it easy to remember the JVM debugging options as shown below:
From Java 5.0, it is better to use the -agentlib:jdwp as a single option e.g. :
$ java -agentlib:jdwp=transport=dt_socket,server=y,suspend=n,address=11001
Options on -Xrunjdwp or agentlib:jdwp arguments are almost the same:
transport=dt_socket: means the way used to connect to JVM (the socket is a good choice, it can be used to debug a distant computer)
address=11001: TCP/IP port exposed, to connect from the debugger,
suspend=y: if 'y', tells the JVM to wait until the debugger is attached to begin execution, otherwise (if 'n'), starts execution right away.
If you are debugging for an event that happens during startup then you can use the suspend="y" to go through the startup sequence step by step. On the other hand, if the issue is happening after it receives a message or request then you can start with suspend="n" and connect it later. See Eclipse Debugging Techniques And Tricks for more of such tips.
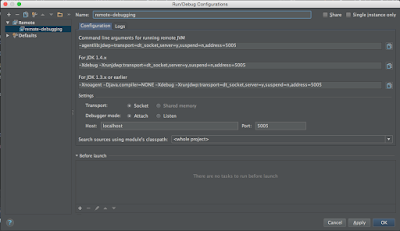
2. Create a Remote Debug Configuration in Eclipse IDE
You also need to create a remote debug configuration in Eclipse IDE before you start debugging. In order to do so, just follow steps:2.1) Go to debug configuration from Run menu as shown below:
2.2) Go to remote Java application
2.3) Configure details e.g. name, project, the Eclipse project which contains the code of the Java application you are trying to debug. Connection type should be "socket attach" and then specify host and port in Connection properties as shown below. Always specify a fully qualified domain name for the host
2.4) Hit apply after making a change
You are done with setting up remote debugging in Eclipse. In the next part of this article, I'll show you how to remotely debug a Java application step by step.
How to Remote debug Java Program in Eclipse
Once you are done with setting up remote debugging in Eclipse IDE, you can follow these steps to start debugging your remote Java program:1. Setup a Breakpoint in Your Code
In order to start debugging, you first need to set up a breakpoint in your code. You can set up a breakpoint at any line by the just left click of mouse i.e. go to your Java code and left-click on any line where you want to stop the JVM.This is also known as line breakpoint, btw, don't put line breakpoint on empty lines. Also, if you are just starting with debugging, you can start by putting a breakpoint in the main() method which is the entry point of the Java application.
2. Start JVM with Debug Arguments
Before you launch your Eclipse remote debugging configuration, you need to start the JVM on the remote host as shown in the following command:$ /oracle/jre/v1.6.0_18-64bit/bin/java -Xdebug
-Xrunjdwp:transport=dt_socket,address=11001,server=y,suspend=y -jar app.jar
A couple of things to note here, we are starting JVM on server mode and asking it to suspend until the debugger connects it, which means it will not start execution until you start your Eclipse IDE and launch remote debug.
It is also listening for the debugger on port 11001, which means your Eclipse remote debugging setting should also use the same port.
Once you start the JVM, it will print the following line the log file or command line, depending upon where you are redirecting the output stream:
Listening for transport dt_socket at the address: 11001
This means JVM is ready to attach the debugger and now it's time to start remote debugging in Eclipse IDE. Btw, if you are not familiar with Java Virtual machines then I suggest you go through the Understanding the Java Virtual Machine series on Pluralsight, which explores JVM Memory Management, Classloading, Security, and other important details.
By the way, you would need a Pluralsight membership to join this course which costs around $29 per month or $299 per year (14% discount). I highly recommend this subscription to all programmers as it provides instant access to more than 7000+ online courses to learn any tech skill. Alternatively, you can also use their 10-day-free-pass to watch this course for FREE.
3. Launch your Remote Debug Configuration in Eclipse
Once JVM is started in debug mode and you can see the above line in the log file, you can just go and launch the remote debug configuration and double-clicking the configuration you have just created. If JVM is running then it will try to connect it using host and port details given in the configuration i.e. 1001 but if JVM is not running then it will show the following error:This error means either your JVM is not running but if you are sure that JVM is indeed started and ready to connect then maybe your host and port configuration is incorrect e.g. any typo on fully qualified domain name or any network issue which preventing your local machine to connect to the remote host.
If your Eclipse IDE is successful to establish a connection to debugger running on remote JVM then Eclipse will open a debug perspective and you could see where exactly JVM has stopped, a full stack trace starting from loading the classes.
Now, you got control of flight and it's up to you how you move.
When you first time debugs a Java program, Eclipse will ask you to open the Debug Perspective and then next time it will automatically do so.
Here is how Eclipse' Debug Perspective look like:
In Debug Perspective, you have a lot of debugging tools like you can execute code step by step, can see where you have put breakpoints, can watch values of variables, and can see which thread you are debugging and can terminate the debugging session. The debug perspective is the same for both local and remote debugging.
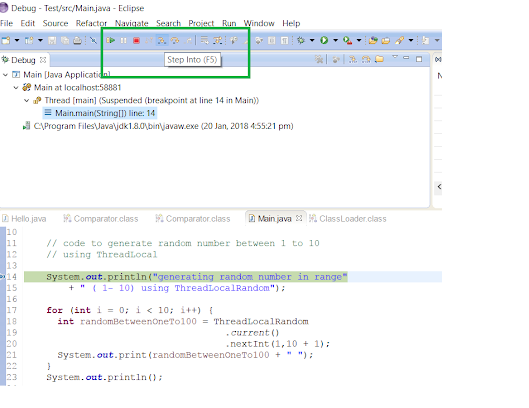
4. Move Step by Step in your Java Code
There are a couple of options to move in your code you can use either Step Into for step by step executing code, which means if the code contains a method call then your code will go inside a method and then initialize variable and other code and finally come back to where you were.Alternatively, you can use Step Over to just go over the method call and move to the new line. You can use a combination of these two commands to effectively move around an interesting read to find any bug or observer the output in the log file. The button to Step Over is just next to Step Into as seen in the above screenshot.
5. Watch values of Variables
While remote debugging your Java application you can also see values of a local variable and member variables into the "Variables" window as shown in the following screenshot:
This is very useful to find out any inconsistency between expected and actual values. You can also add a variable to the watch window to periodically check its value.
6. Terminate the JVM
Once you are done with remote debugging and find the root cause of your problem you can terminate the remote Java application right from the Eclipse IDE. This will stop the JVM as well Eclipse remote debug console, but if you don't want to stop the JVM on the remote host then just click the disconnect button and it will stop the debugging process in Eclipse.That's all about how to set up remote debugging in Eclipse IDE and how to remote debug a Java application running on the Linux server. The key is that you should have the same version of a class file and Java source file on both remote and local machines.
If your Java source code is not in sync with the class file on the remote host then the debugging will be inaccurate i.e. you will set a breakpoint at line 5 but your code will be running line 10, hence it is an absolute must that both code and binary running on the remote host must be of the same version.
Other Java Articles, courses, and guides you may like
- The Complete Java Developer RoadMap
- Top 30 Eclipse keyboard shortcuts for Java Programmers
- 10 Tips to debug a Java Program in Eclipse
- Top 7 Courses to learn Microservices in Java
- 10 courses for Programming/Coding Job Interviews
- Top 5 Courses to learn Spring in Depth
- 5 Online Courses to learn Core Java for Free
- 3 Maven Eclipse Tips for Java Developers
- 5 Free Courses to learn Eclipse and JUnit
- 10 Tips to become a better Java Developer
- 5 Courses to Learn Web Development for Beginners
- 10 Advanced Java books for Experienced Developers
- Top 5 Courses to learn Regular Expression
- Top 5 Java design patterns courses for experienced Java devs
- 10 Advanced Spring Boot Courses for Java developers
- Top 5 Courses to learn Spring Cloud for Beginners
- 5 Courses to learn Shell Scripting in Linux
- 10 Free Spring Boot Tutorials and Courses for Java Devs
Thanks for reading this article so far. If you like this article then please share it with your friends and colleagues. If you have any questions or feedback or facing any problem while setting up Eclipse for remote debugging then please drop a comment and I'll try to help you out.
P. S. - If you are new to the Java world and looking for some free online courses to start learning Java programming language then you can also, check out Java Programming: Beginner to Guru - A free course on Udemy to start your Java developer journey.
Amazing explanation. As easy to follow as possible
ReplyDelete